Building Dashboards That Actually Help You Run Your Business
Published 2025-11-12
Business dashboards are powerful tools that provide a visual representation of an organization's key performance indicators (KPIs) and metrics. The primary purpose of business dashboards is to offer a real-time snapshot of the company's per
Business dashboards are powerful tools that provide a visual representation of an organization's key performance indicators (KPIs) and metrics. The primary purpose of business dashboards is to offer a real-time snapshot of the company's performance, allowing decision-makers to quickly assess the health of the business and identify areas that require attention. These dashboards consolidate data from various sources, such as sales, marketing, finance, and operations, into a single interface, enabling users to gain insights and make informed decisions. By presenting complex data in a visually appealing and easy-to-understand format, dashboards help stakeholders monitor progress towards goals, track trends, and identify opportunities or potential issues. Effective business dashboards should be tailored to the specific needs of the organization and its stakeholders. They should provide relevant and actionable information that aligns with the company's strategic objectives. Whether it's tracking sales targets, monitoring customer satisfaction, or analyzing financial performance, dashboards should focus on the metrics that matter most to the business. Additionally, they should be designed with user experience in mind, ensuring that they are intuitive and easy to navigate for all users, regardless of their technical expertise.
Key Takeaways
- Business dashboards should be designed to help you make informed decisions and run your business more effectively.
- Effective business dashboards should include key components such as KPIs, data visualization, and integration of multiple data sources.
- ClickUp can be utilized for streamlined dashboard creation, making it easier to design and customize dashboards for your specific business needs.
- User-friendly dashboards should follow best practices in design, such as using clear and intuitive layouts and navigation.
- Data visualization can help drive business decisions by presenting complex data in a visually appealing and easy-to-understand format.
Key Components of Effective Business Dashboards
An effective business dashboard typically consists of several key components that work together to provide a comprehensive view of the organization's performance. These components include visualizations such as charts, graphs, and tables that display KPIs and metrics in a clear and digestible manner. Additionally, dashboards often incorporate filters and drill-down capabilities, allowing users to interact with the data and explore specific details or trends. Another essential component of a business dashboard is the use of real-time or near-real-time data. This ensures that the information presented is current and relevant, enabling stakeholders to make timely decisions based on the most up-to-date insights. Furthermore, effective dashboards often include alerts and notifications that can be configured to notify users when certain thresholds or targets are met or when anomalies are detected in the data.
Utilizing ClickUp for Streamlined Dashboard Creation
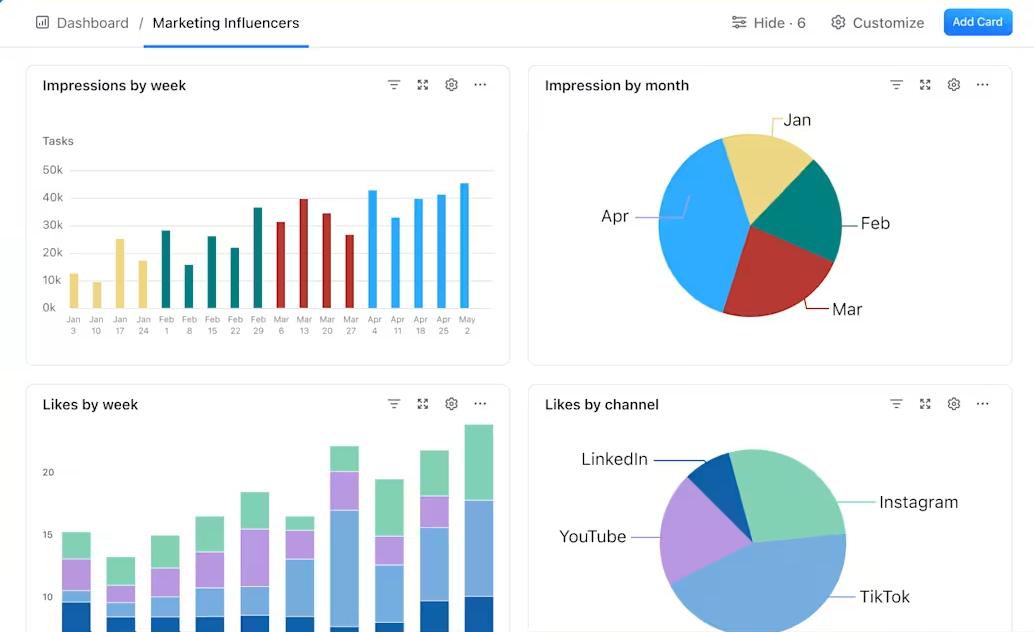
ClickUp is a versatile project management platform that offers robust features for creating and customizing business dashboards. With ClickUp, users can easily aggregate data from various sources and visualize it in a way that suits their specific needs. The platform provides a range of widgets and integrations that allow users to display KPIs, metrics, and other relevant information in a visually appealing format. ClickUp's dashboard creation capabilities enable users to build personalized dashboards that align with their unique requirements. Whether it's tracking project progress, monitoring team performance, or analyzing sales data, ClickUp offers the flexibility to design dashboards that cater to diverse business needs. Additionally, ClickUp's intuitive interface and drag-and-drop functionality make it easy for users to customize their dashboards without requiring extensive technical expertise.
Best Practices for Designing User-Friendly Dashboards
Best Practices for Designing User-Friendly Dashboards
---
1\. Understand your audience
2\. Keep it simple and focused
3\. Use consistent and intuitive navigation
4\. Prioritize important information
5\. Use visual hierarchy and clear visualizations
6\. Provide interactive elements for exploration
7\. Ensure responsiveness for different devices
When designing user-friendly dashboards, it's essential to consider the needs and preferences of the end users. A key best practice is to keep the dashboard layout clean and uncluttered, focusing on displaying only the most relevant information. Clear and concise labeling of visualizations and data points can help users quickly understand the insights being presented. Furthermore, it's important to ensure that the dashboard design is responsive and accessible across different devices and screen sizes. This allows users to access the dashboard from various platforms without compromising the user experience. Additionally, providing customization options such as the ability to rearrange widgets or choose preferred data views can enhance user engagement with the dashboard.
Leveraging Data Visualization to Drive Business Decisions
Data visualization plays a crucial role in driving business decisions by transforming complex data sets into easily understandable visuals. Visualizations such as bar charts, line graphs, heat maps, and pie charts can help stakeholders identify patterns, trends, and outliers within the data. By presenting information in a visually compelling manner, data visualization facilitates quicker comprehension and interpretation of key insights. Effective data visualization also enables stakeholders to communicate findings and recommendations more effectively within the organization. Whether it's presenting sales performance trends to the executive team or sharing customer satisfaction scores with the marketing department, visual representations of data can convey information compellingly and persuasively.
Integrating Multiple Data Sources into Your Dashboards
In today's data-driven business landscape, organizations often rely on multiple data sources to gain a comprehensive understanding of their performance. Integrating these disparate data sources into a single dashboard can provide a holistic view of the business and enable stakeholders to make more informed decisions. Whether it's combining sales data from CRM systems, website analytics from Google Analytics, or financial data from accounting software, integrating multiple data sources into dashboards can offer a more complete picture of the organization's performance. To achieve this integration, organizations can leverage tools and platforms that support seamless data connectivity and integration. By consolidating data from various sources into a unified dashboard, businesses can gain insights that would otherwise remain siloed within individual systems.
Measuring the Impact of Dashboards on Business Performance
Measuring the impact of dashboards on business performance is essential for evaluating their effectiveness and identifying areas for improvement. One way to measure impact is by tracking key metrics related to decision-making and operational efficiency before and after the implementation of dashboards. For example, organizations can monitor changes in response times to critical issues, improvements in meeting KPIs, or increases in overall productivity as indicators of dashboard impact. Additionally, gathering feedback from dashboard users through surveys or interviews can provide valuable insights into how dashboards are being utilized and their perceived value. Understanding how stakeholders interact with dashboards and the specific insights they derive from them can inform iterative improvements to enhance their effectiveness. In conclusion, building effective business dashboards requires a deep understanding of the organization's goals and KPIs, as well as a focus on user experience and data visualization best practices. By leveraging tools like ClickUp for streamlined dashboard creation and integrating multiple data sources into dashboards, businesses can harness the power of real-time insights to drive informed decision-making and ultimately improve overall business performance.
← Back to the Journal · Royal Assistants